最大能跌到950? 有人说1100啊
not4weak 发表于 2012-1-1 14:45

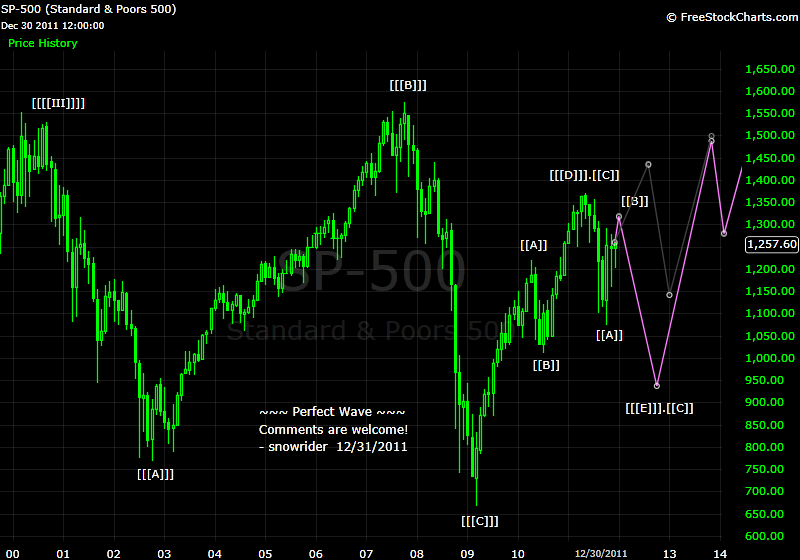
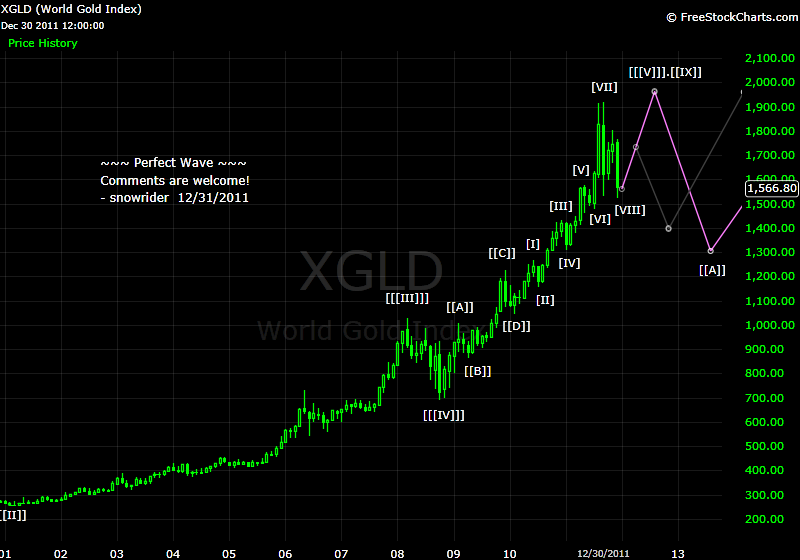
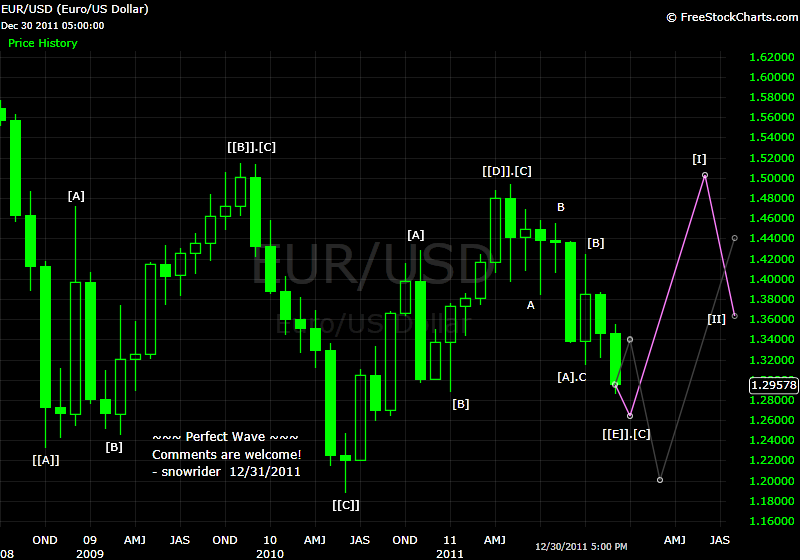
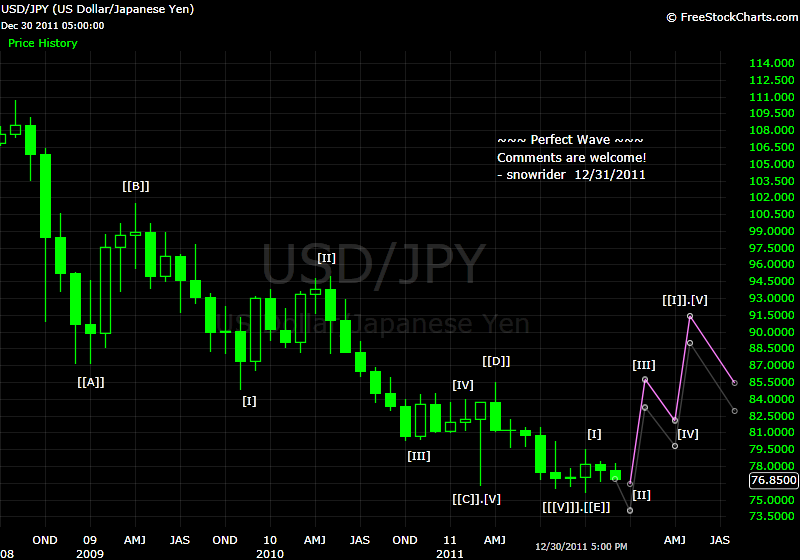


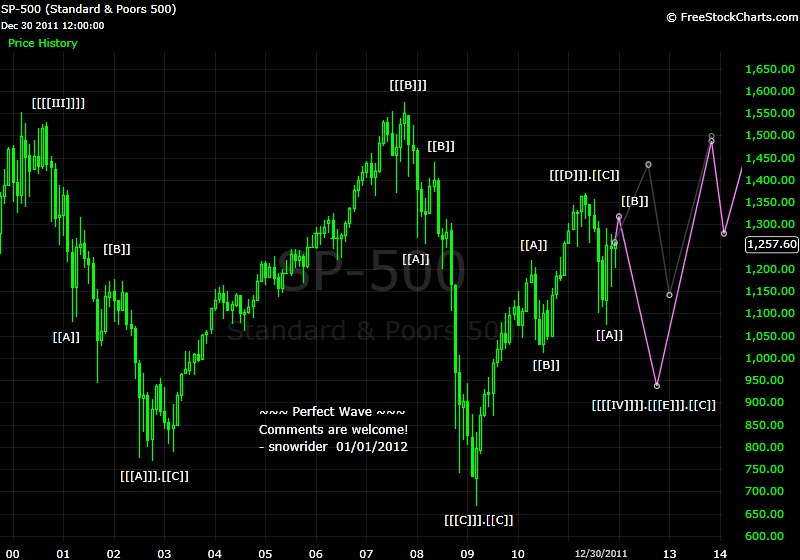

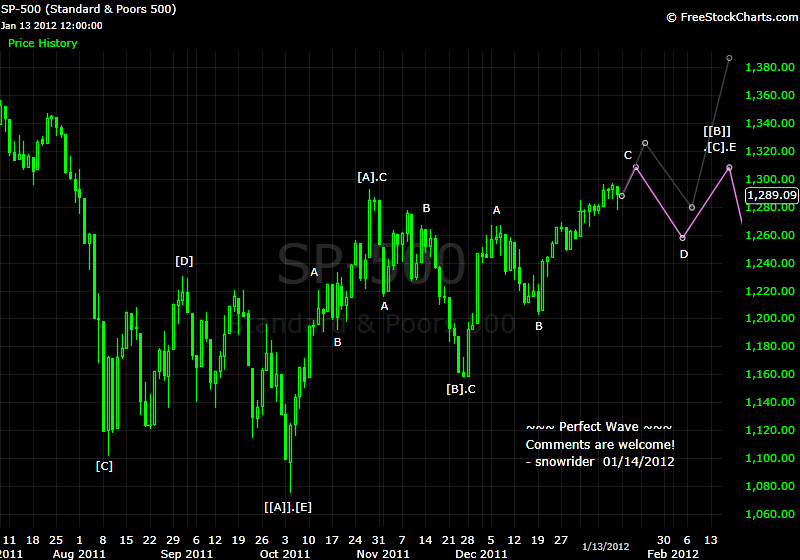
where does your count put the highs in on the sp? i reckon we are going to 1330 ish before trading down into the summer making a decent bounce into end of year


Quote from jas_in_hbca:
Long term EW count question.
Could 1987 be a end of wave 1, (approx) 2000 end of wave 3,
2008 end of wave 5 ?
If so, then could 2009 bottom be wave A , 2011 top end of a 'B' ?
and where would a projected wave C end ?
Thanks !
20120109 DJIA Worst Scenario
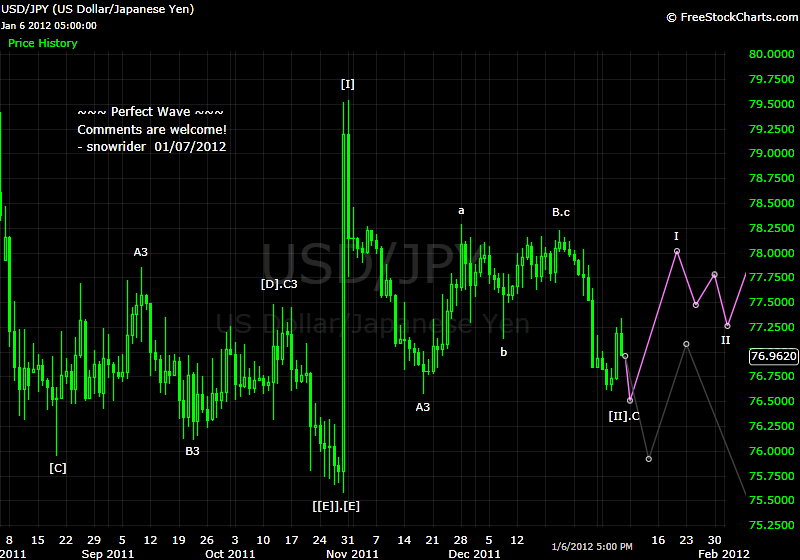
这和你上面的SP的图不大一样呢?
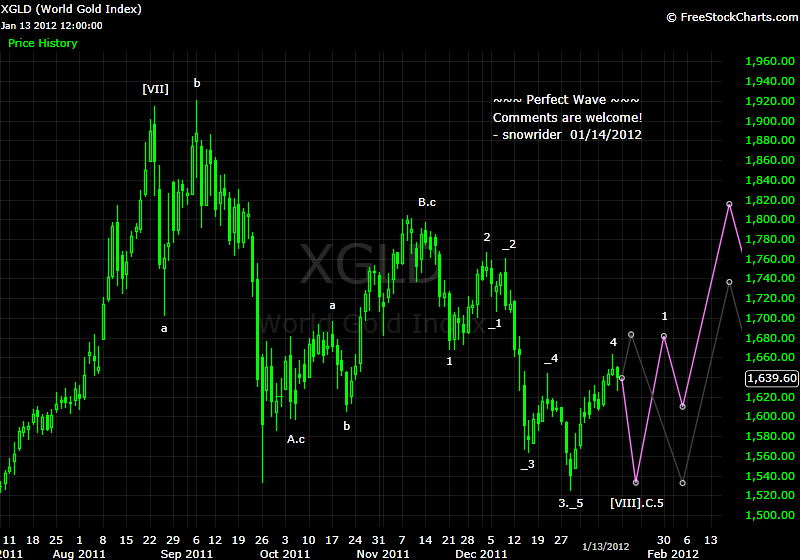
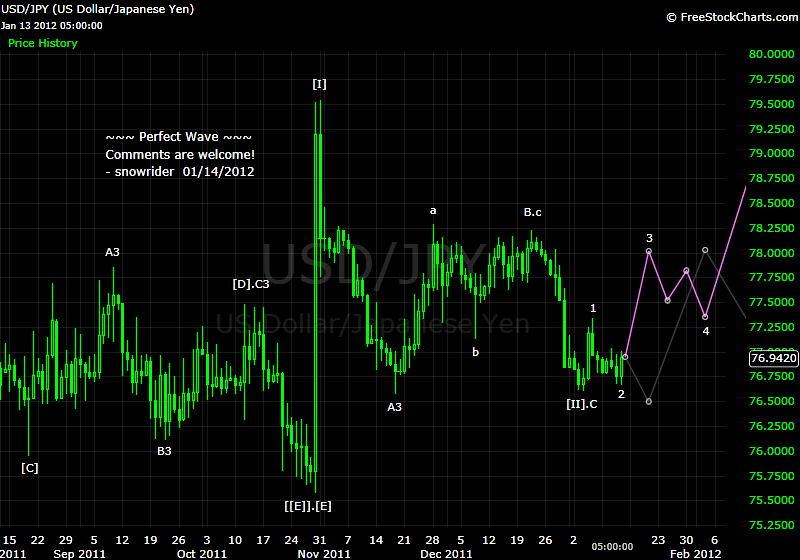
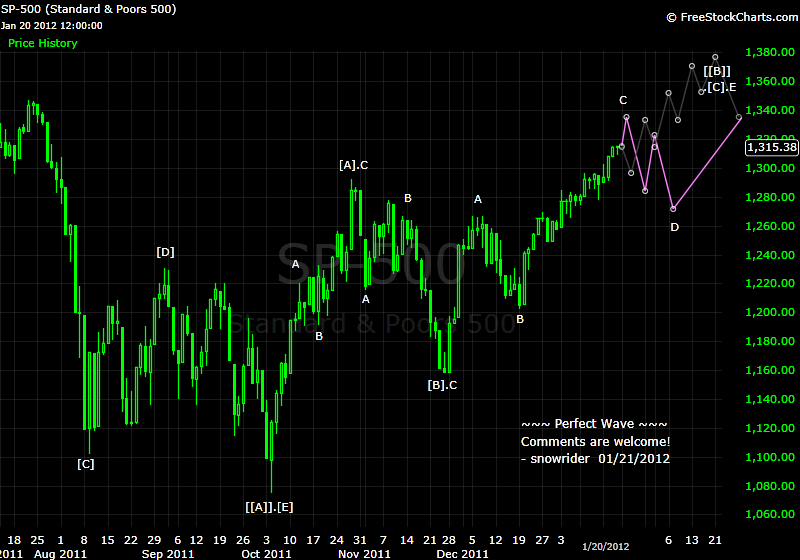
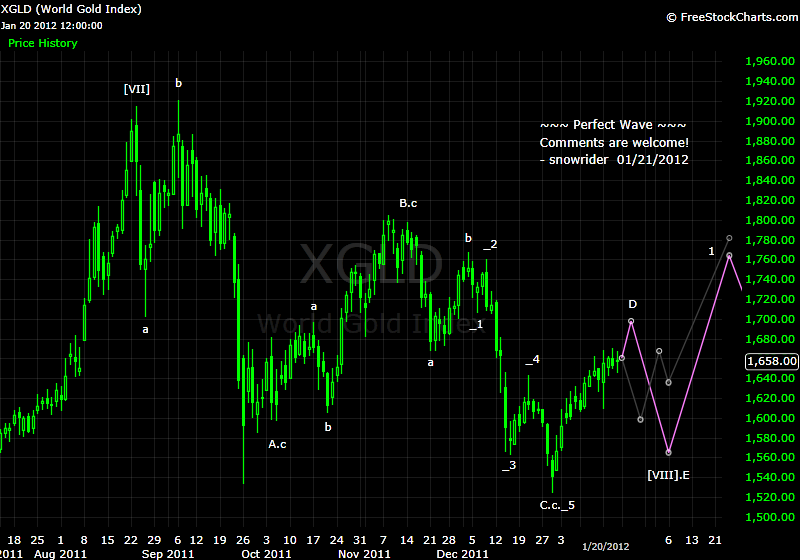
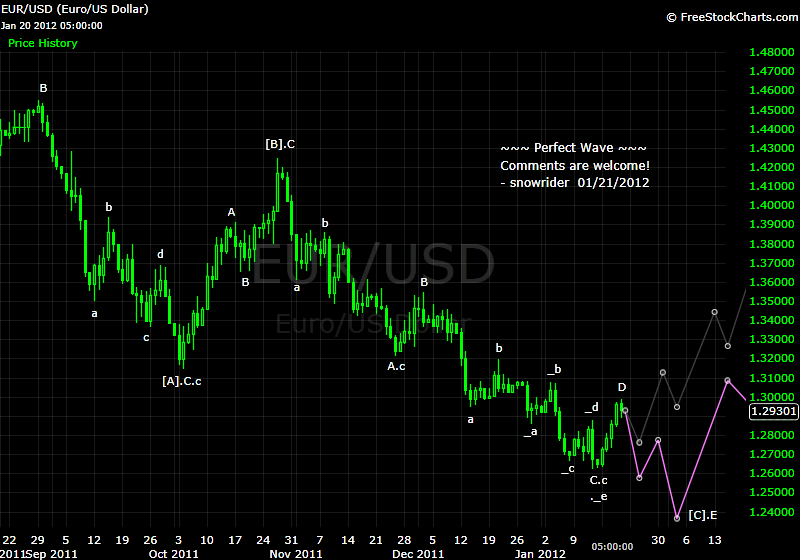
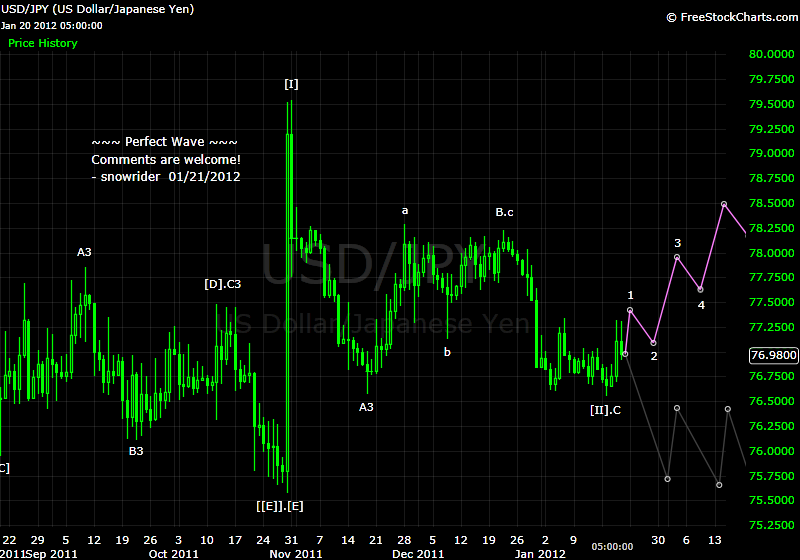
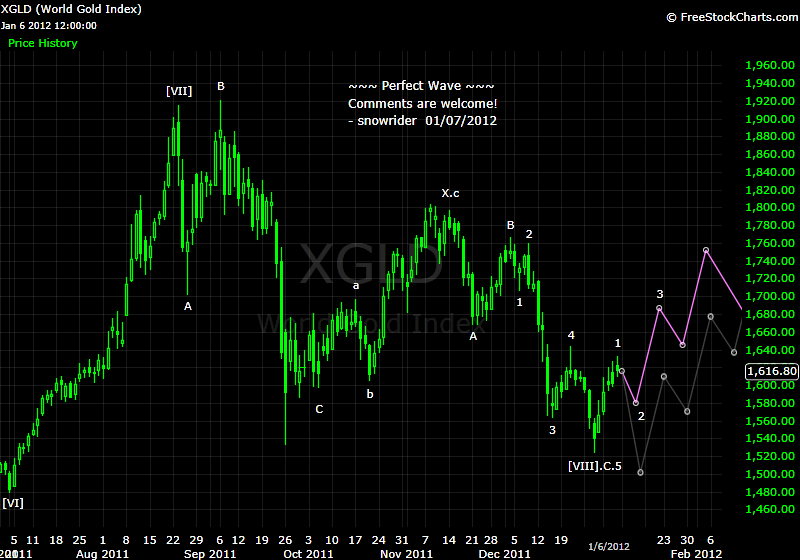
i agree with your projections on gold, but im not sure your wavecounts match mine. i like to keep it simple, so i only use waves 1-5 and then abc.
...
...
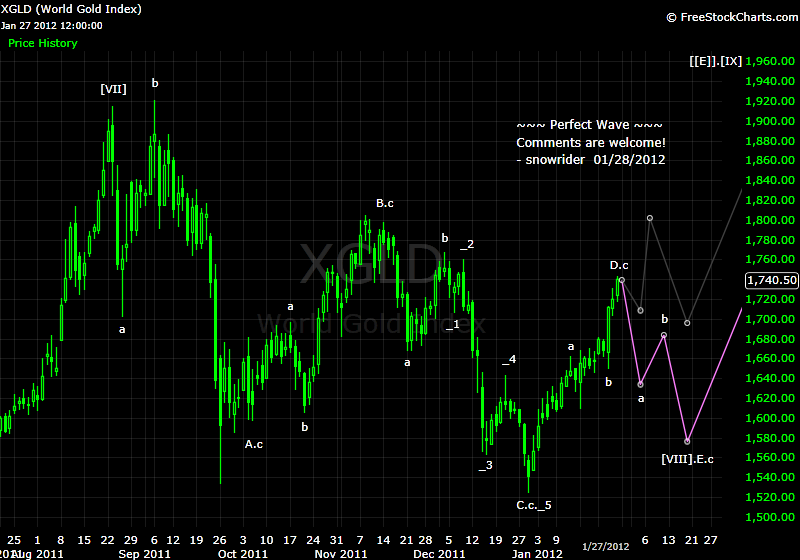
i think wave 5 of wave A was over at 1522, assuming 1920 was end of wave 3. right now we're in wave B which could go as high as 1760 area. then wave c will break to new lows...maybe mid 1300's?
then we'll have the last wave 5 which will take out the high of 1920, but dont have a projection for it.
note: i'm not an elliott wave junkie. i did this analysis in 10mins looking at monthly chart, just to get a feel for where we are right now in the cycle.
We will be there from 02/06 to 02/10. Do you want to join us to ski a day or two?
snowrider 发表于 2012-1-27 14:03
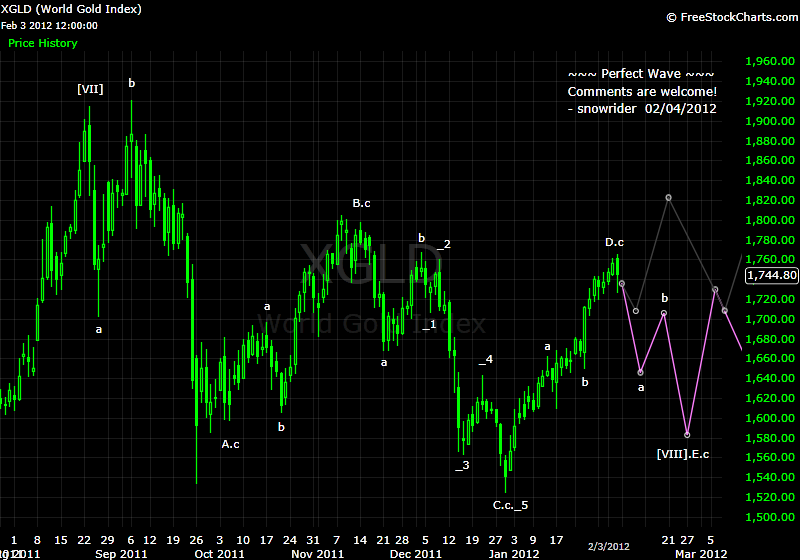
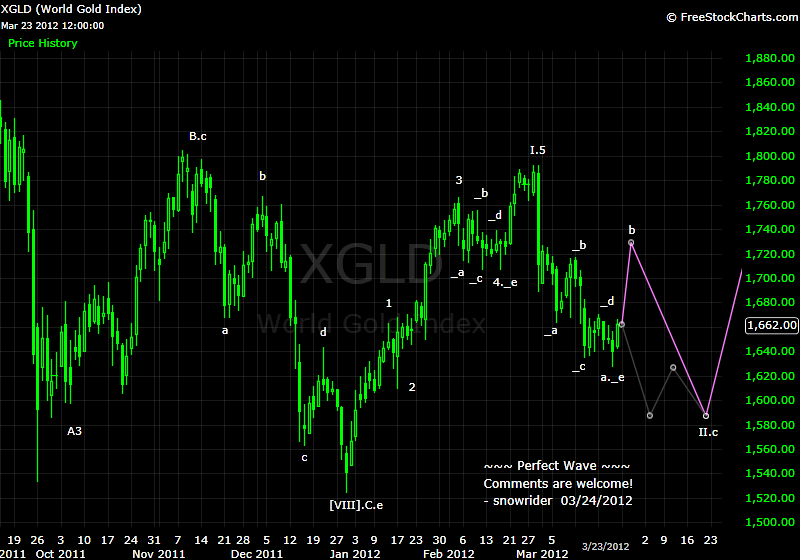
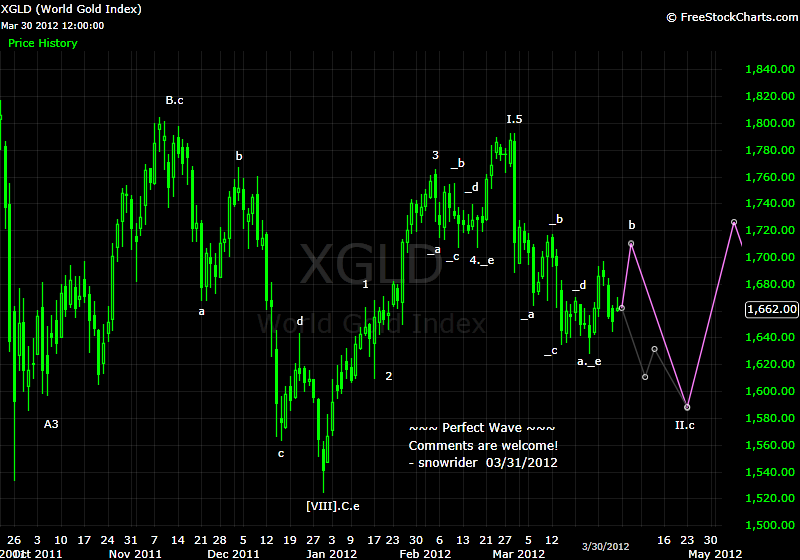
for gold, you're saying that the c wave might have ended. you have wave a from 1522-1662, b wave from 1662-1625, and c wave from 1625-1738.
however your c wave is only 113 pts long, compared to wave a's length of 140.
c waves are often longer than a waves, going upto 1.618 times wave a, so why do you think c wave will be truncated this time?
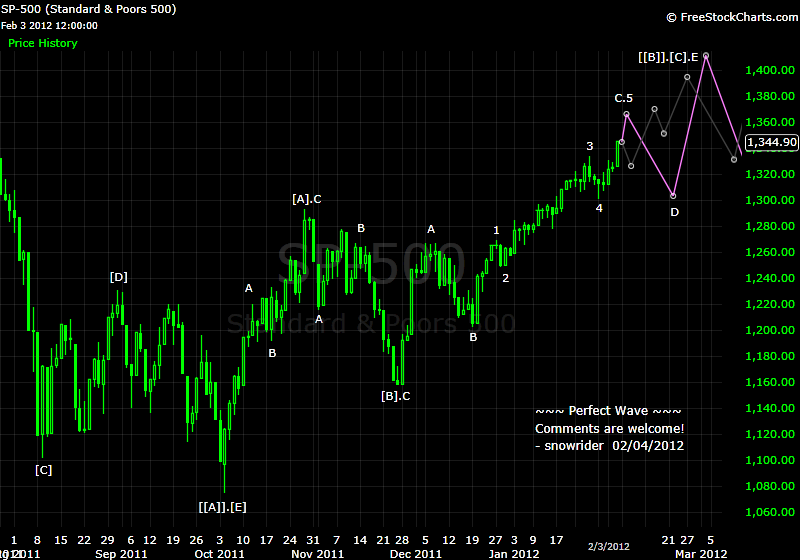
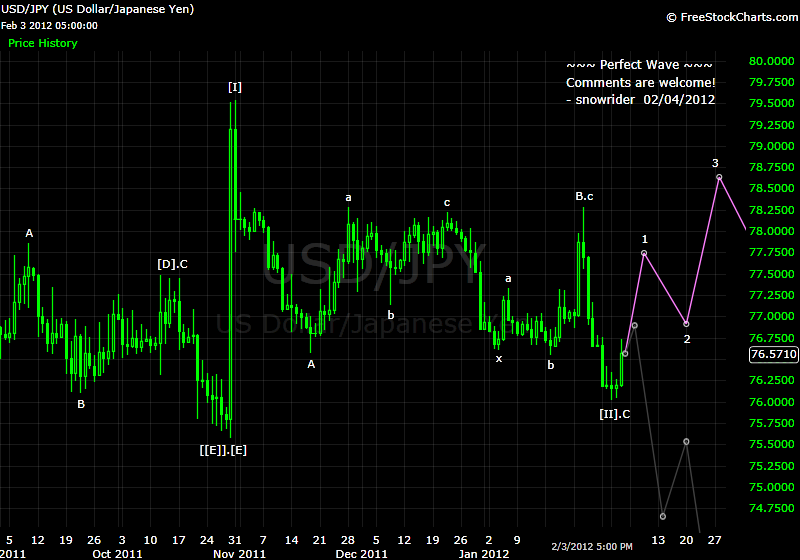
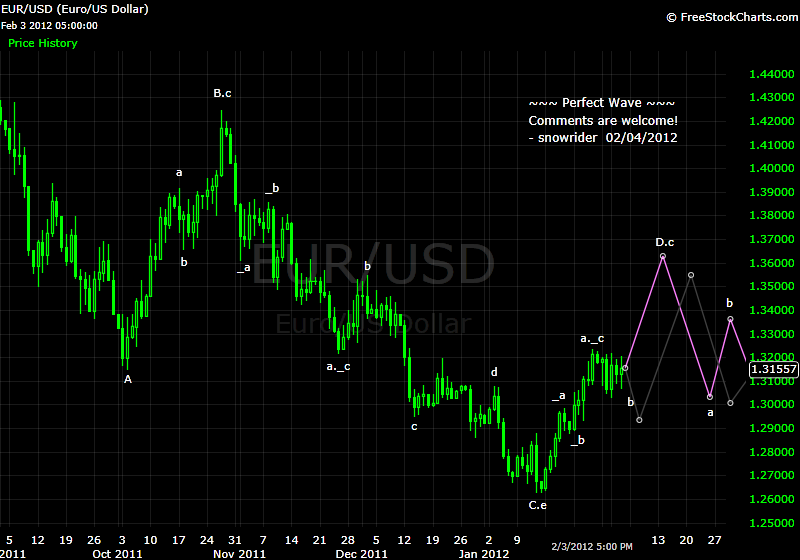
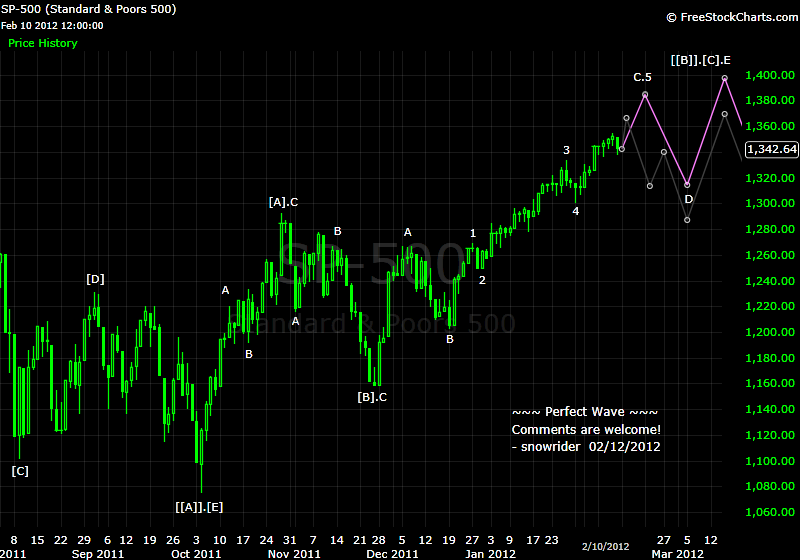
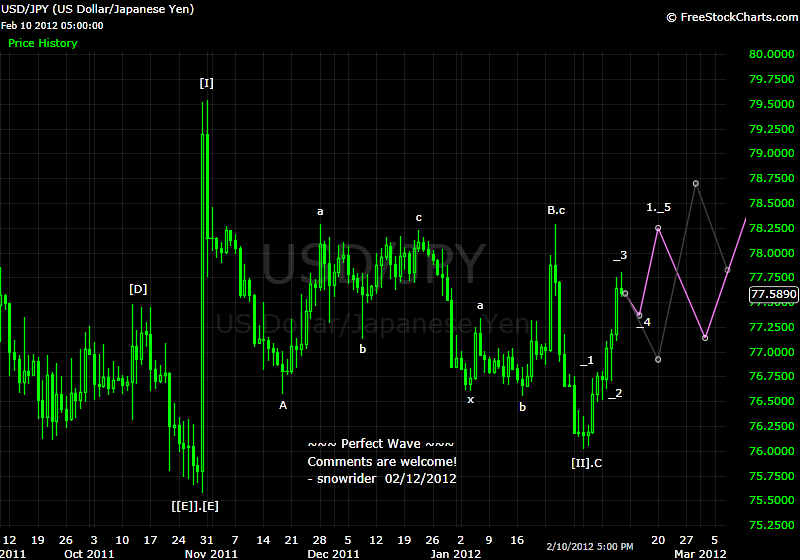
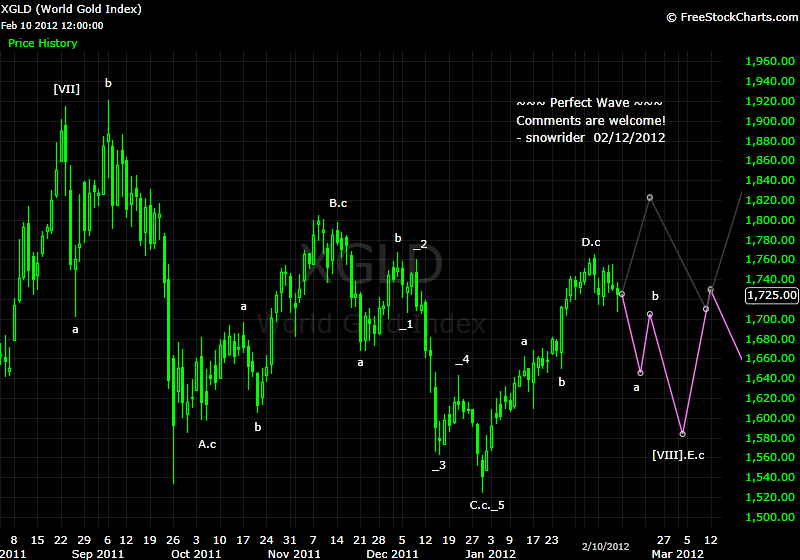
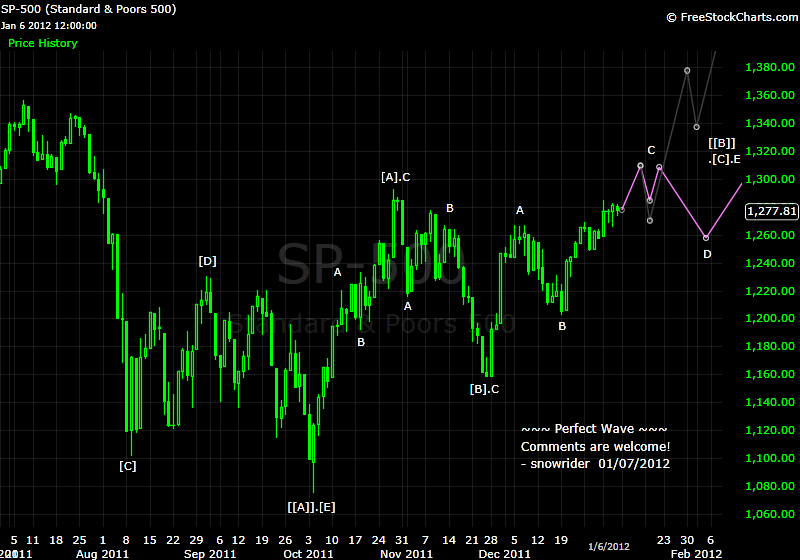
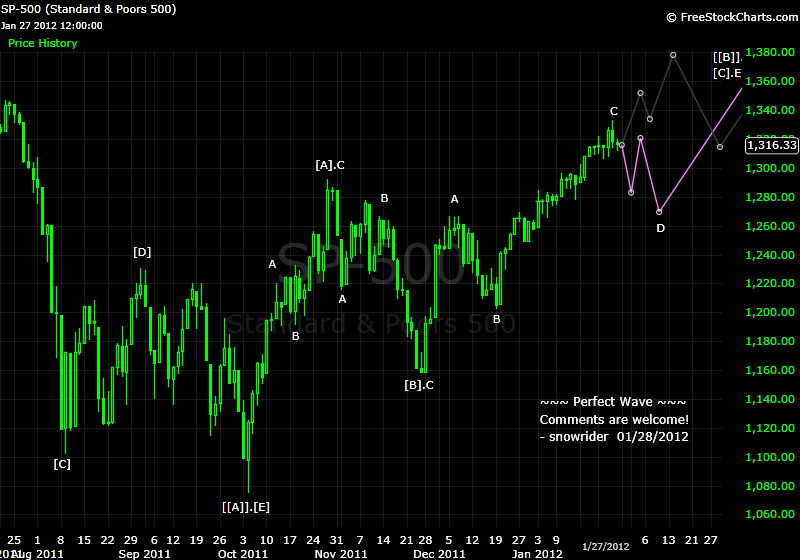
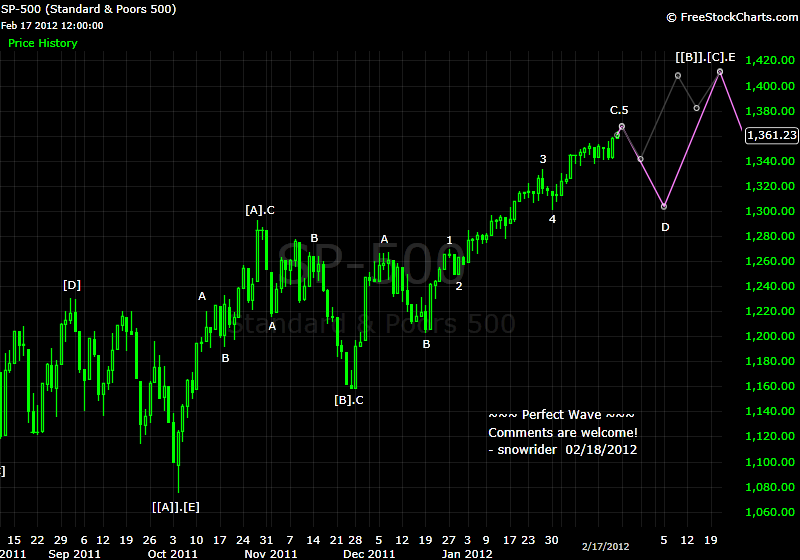
1) if SPX goes to 1370 first before C5 formed, the C5 will equal C3, or may be great than C3, right ? but we know C5 can't be great than C3 according Wave Theory. How can we explain this?
2) If C5 is really formed at 1370, the Fib 61.5% pull back target should be great than 50 point, right ?
3) how can we draw the a-b-c waves after C5 (It's not indicated in the chart ??) I mean wave 'b' is great than C5 <-- Does it mean 'extend' wave instead of a-b-c waves (purple lines) ?
I'm a big fan of Elliot wave theory and harmonic trading, however you way over complicate the labeling which deters me (and probably others) from following along. Simply stating the pair and TF (in post) with wave counts 1,2,3,4 a,b,c,d and sub waves as 1a, 1b, 1c, 1d ect works just fine. This, of course, is just my opinion, in the whole scheme of things, it doesn't make much difference.
Big ups for the thread though not many people keep up with these sort of threads. So even if you don't conform to my way of thinking do keep posting charts others will surely find it helpful or at the vary least interesting.
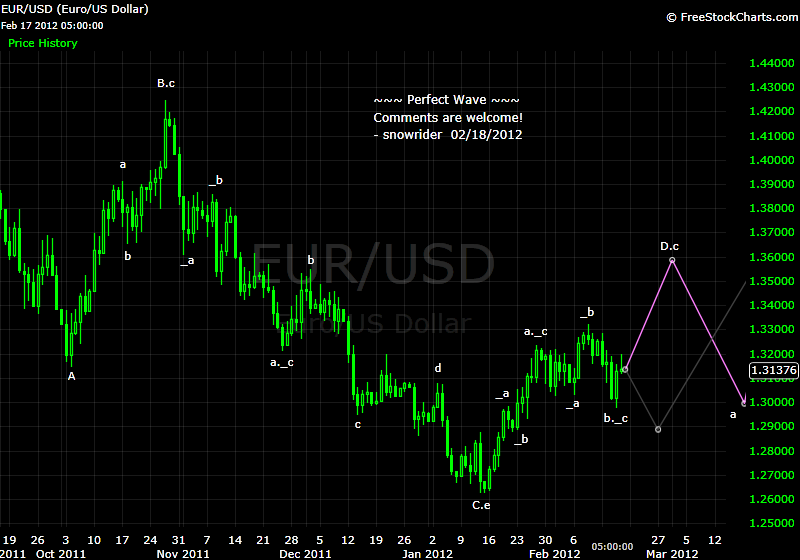
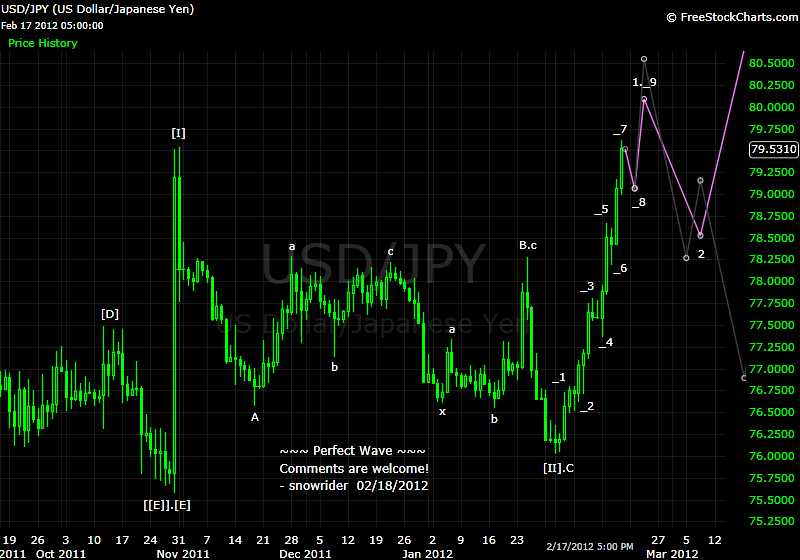
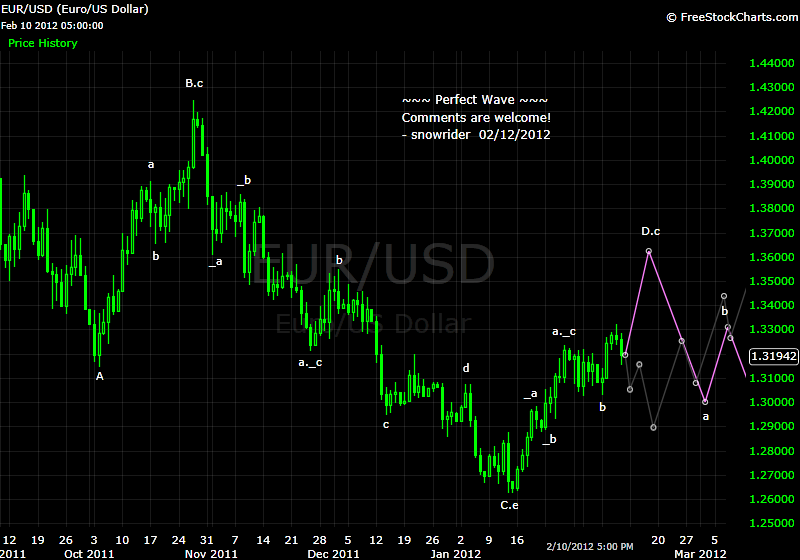
Rothschild - I would guess that SP spot index 1320 area could be where the reversal starts. We ...
snowrider 发表于 2012-1-1 23:00
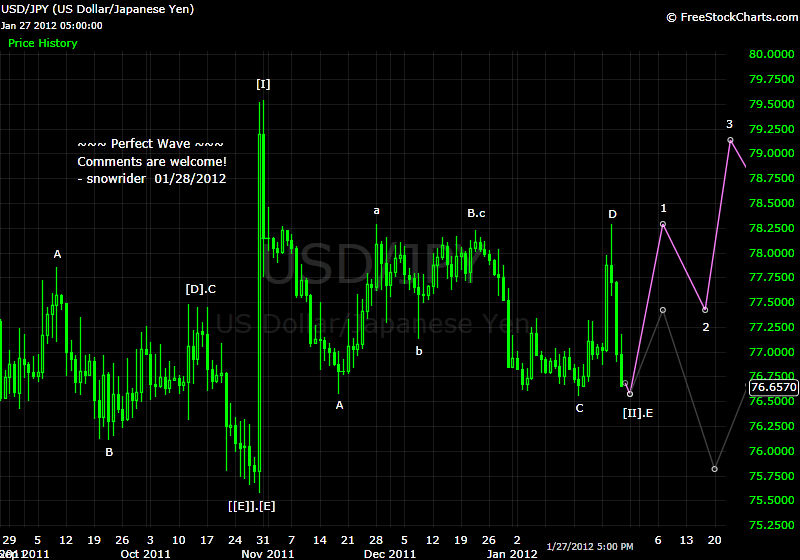
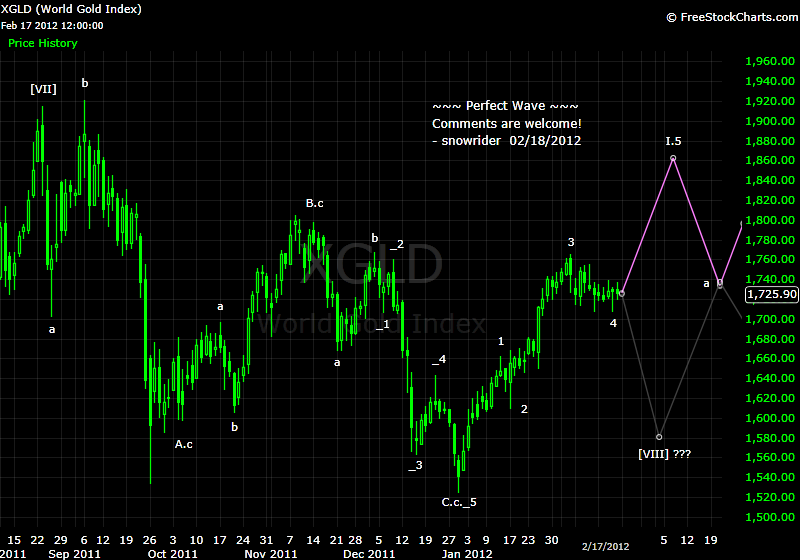
for gold, you're saying we're in a triangle, with the E wave having started lower. However, the triangle connecting ABCDE you show is neither descending, ascending, or symmetrical. Am I missing something?


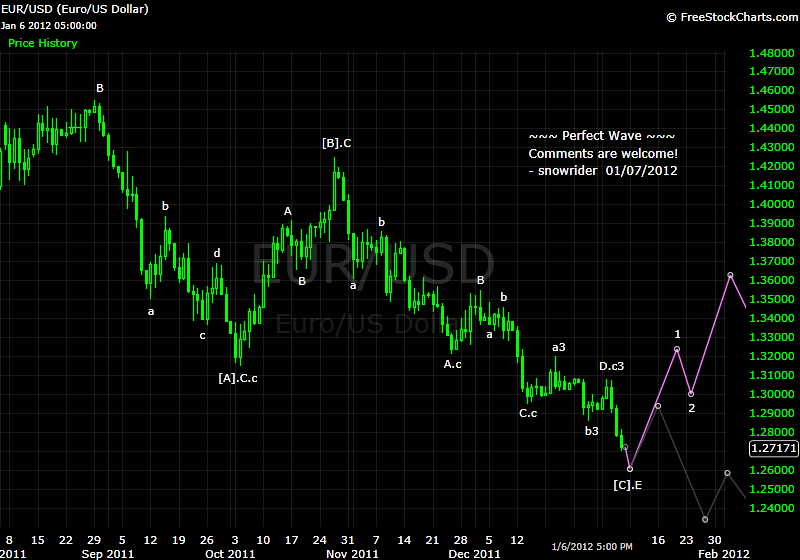
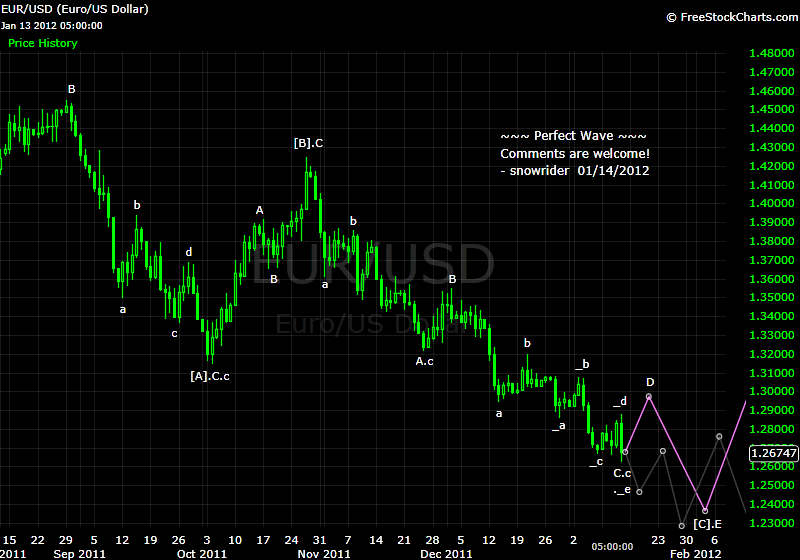
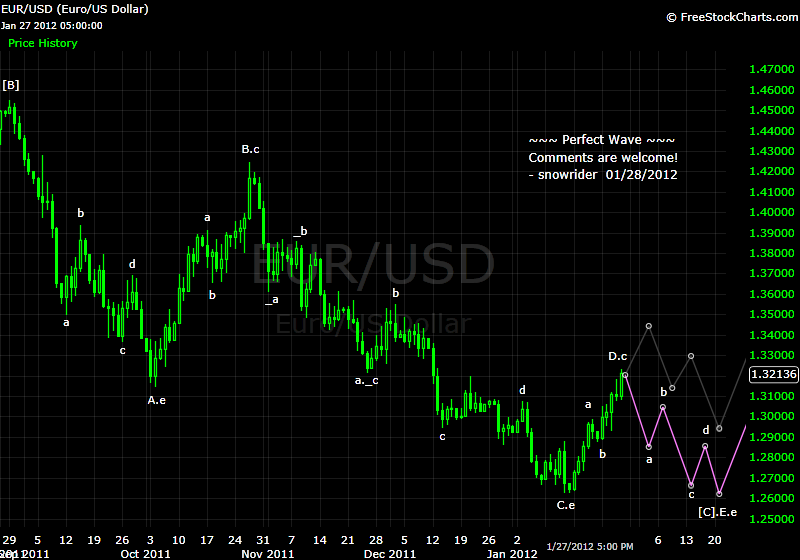
雪骑老大:能否谈一下去年日本干预日元对EUR/USDchart形态有没有影响?如有这种影响是否会随时间而逐渐矫正?
偶像,想不通为啥你预测欧元、黄金涨,大盘咋就跌呢?
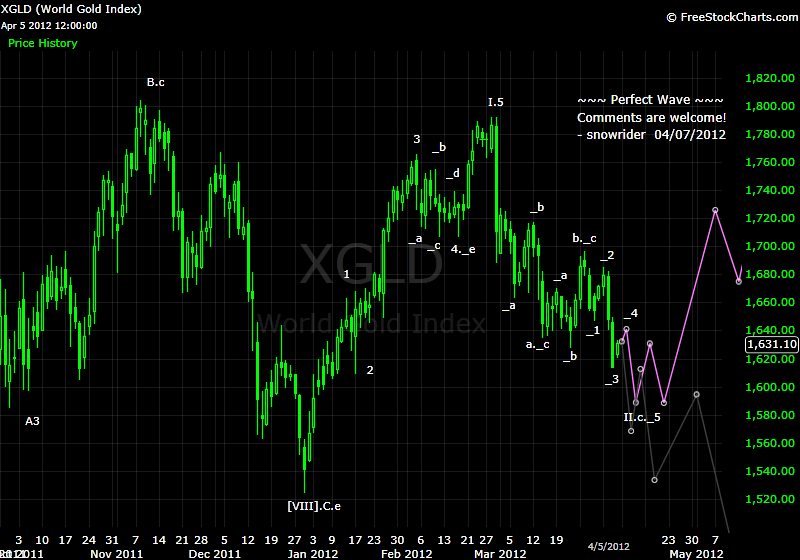
GOLD的走势 啥可能性都有啊 汗一个
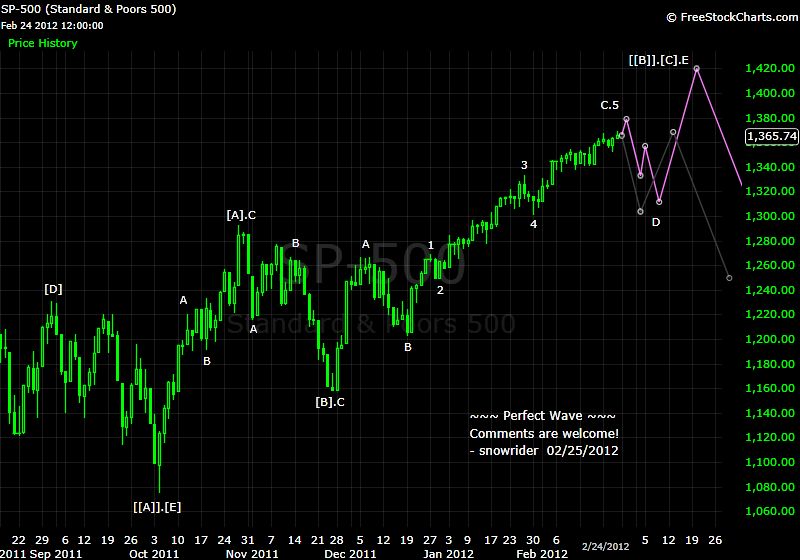
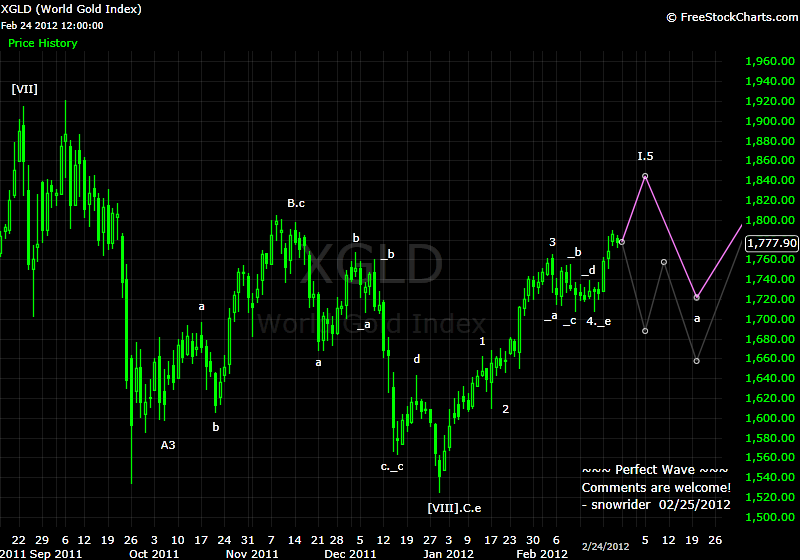
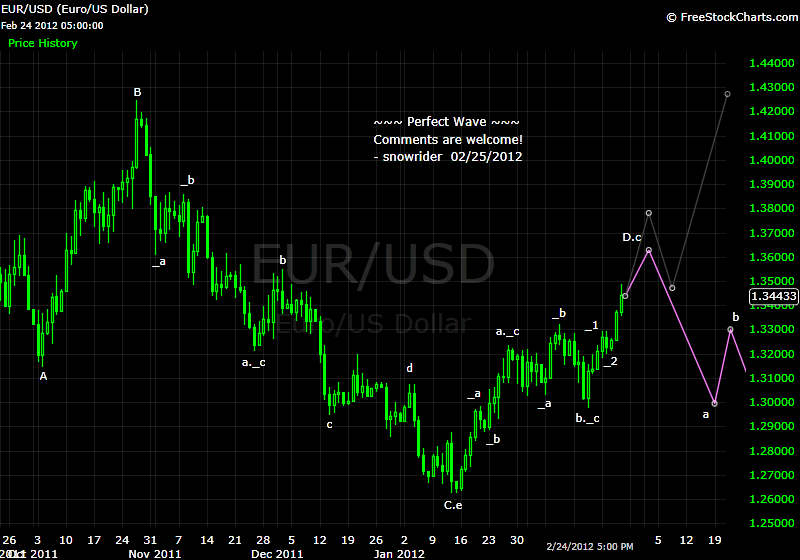
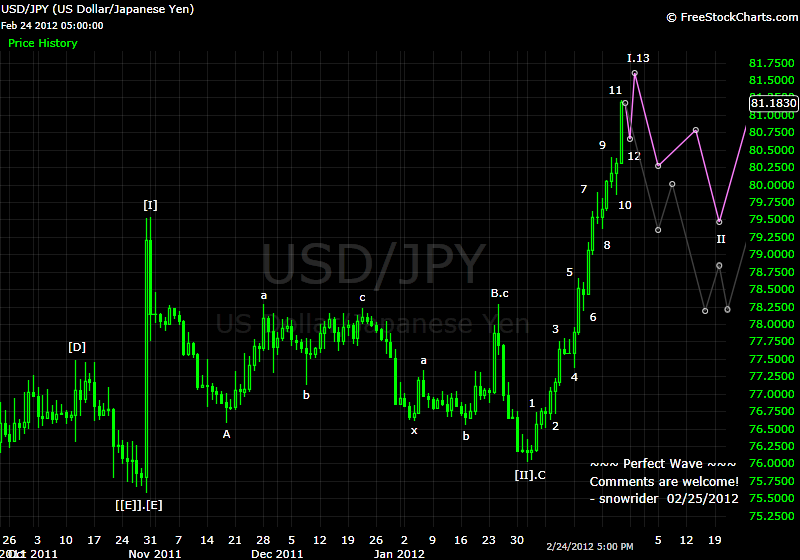
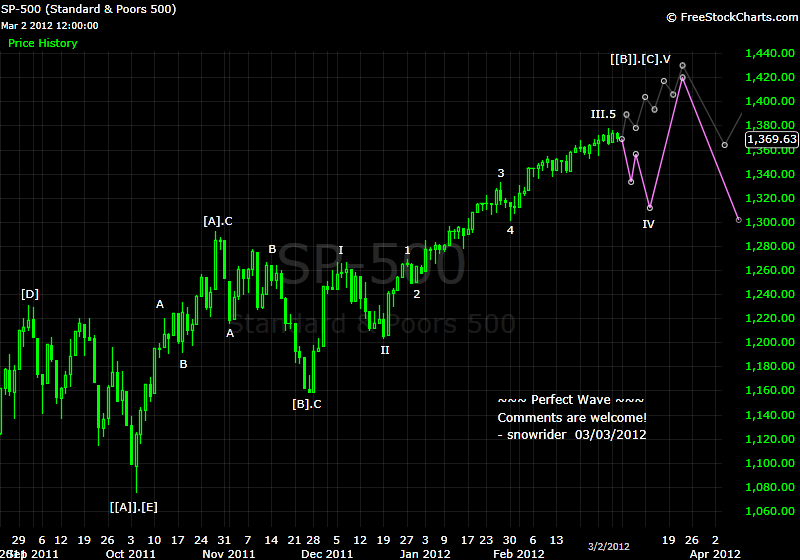
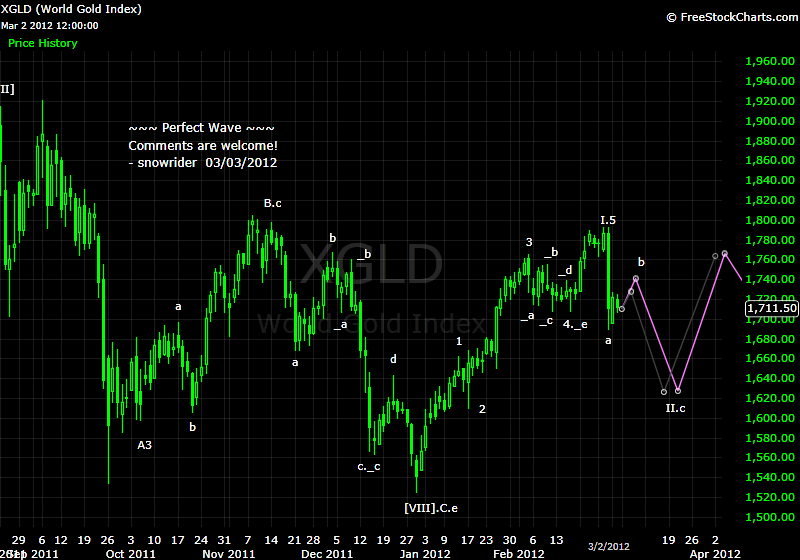
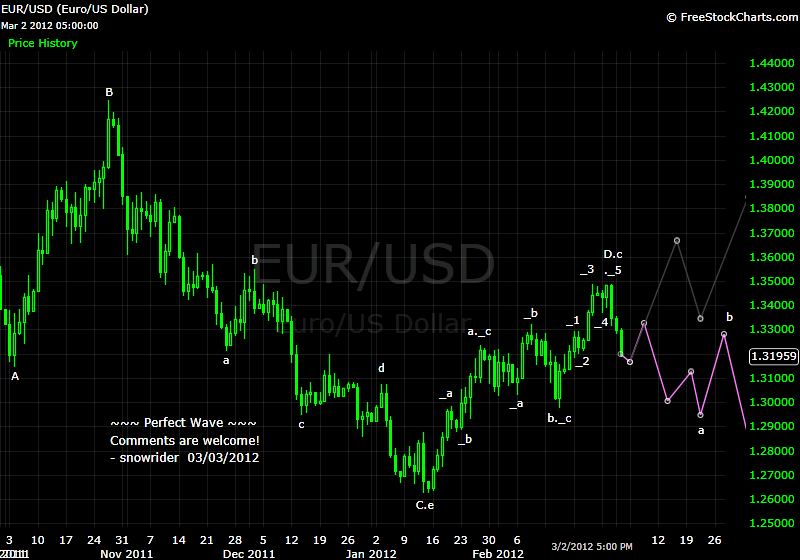
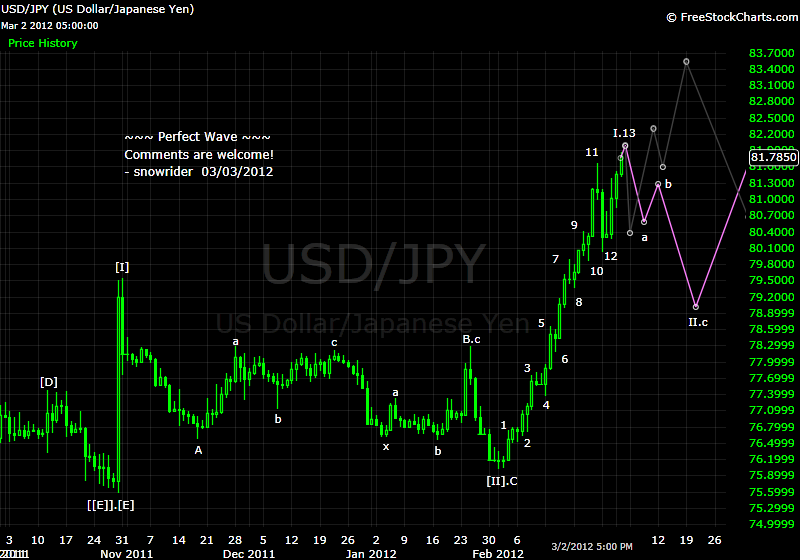
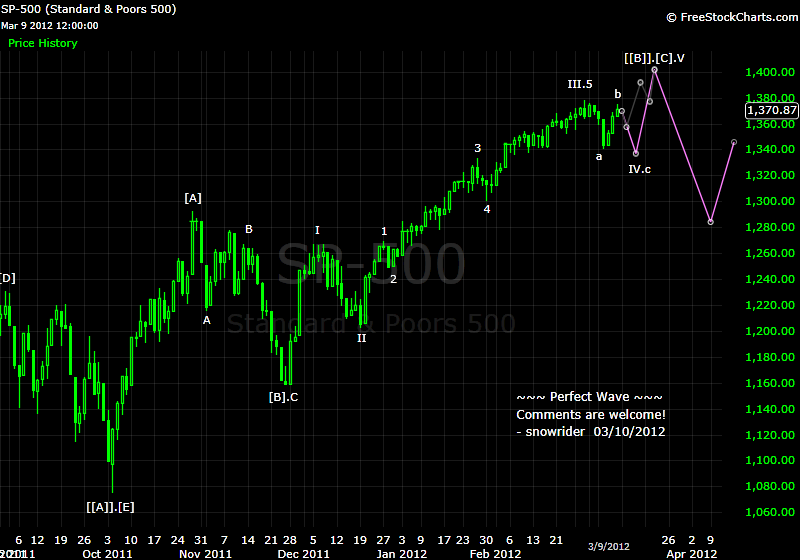
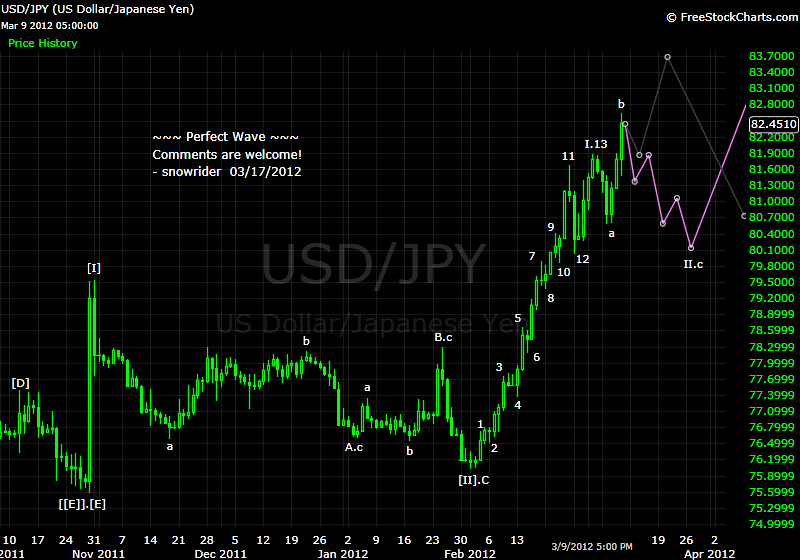
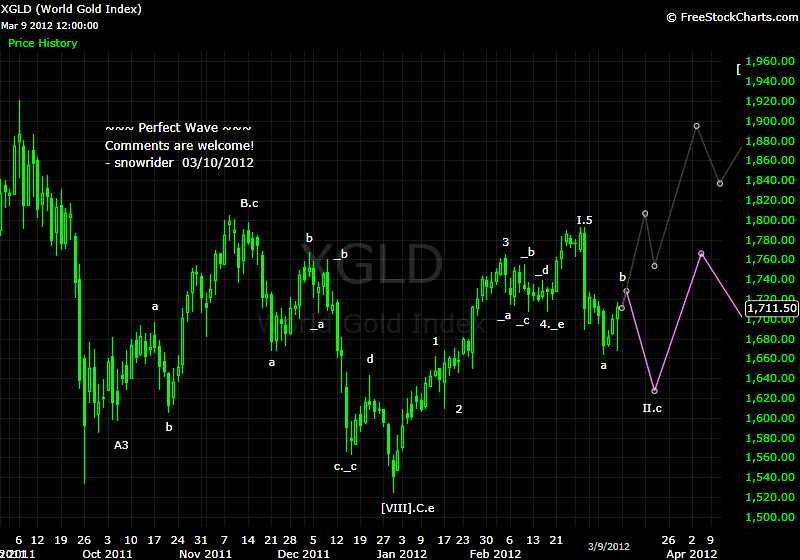
这波预测的1400算到了吗?
下周开始熊熊就好过了?
Quote from jas_in_hbca:
[B]bot a few apr 505 puts on aapl @ 2.88
looking for 540 to exit some
nice count . hopefully this 5th wave doesnt extend.
looks like a possible exhaustion gap yesterday on hi vol too [/B]
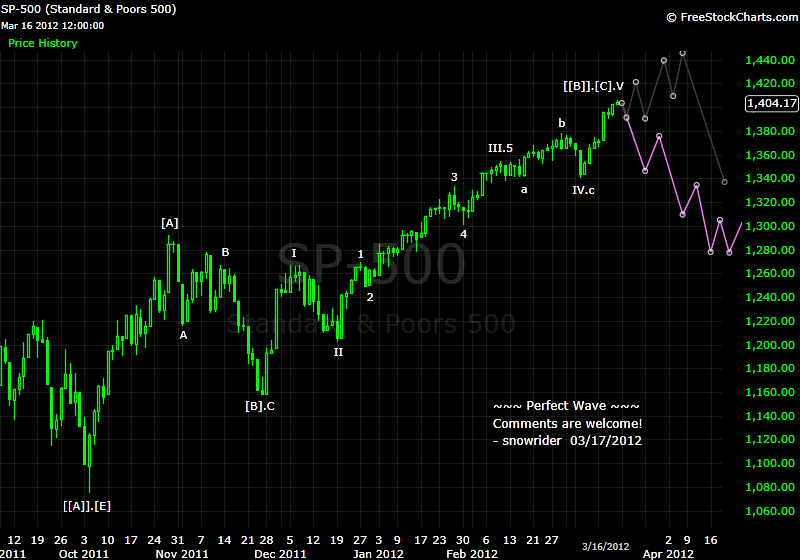
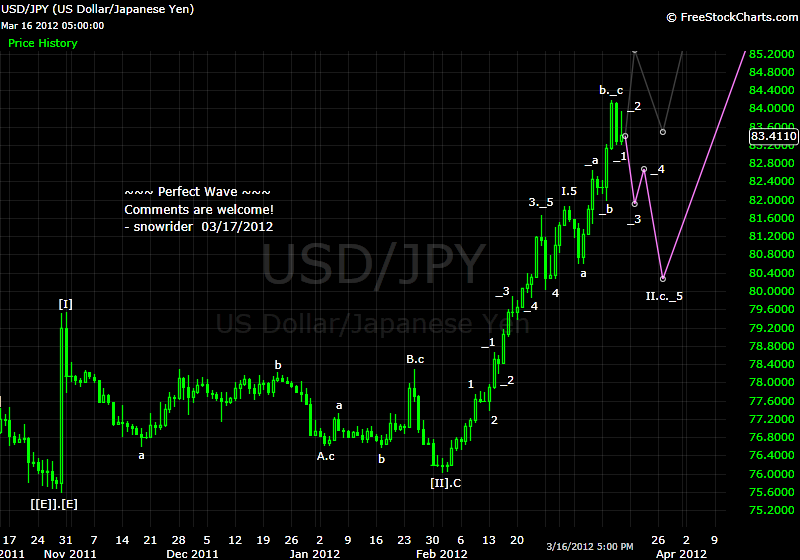
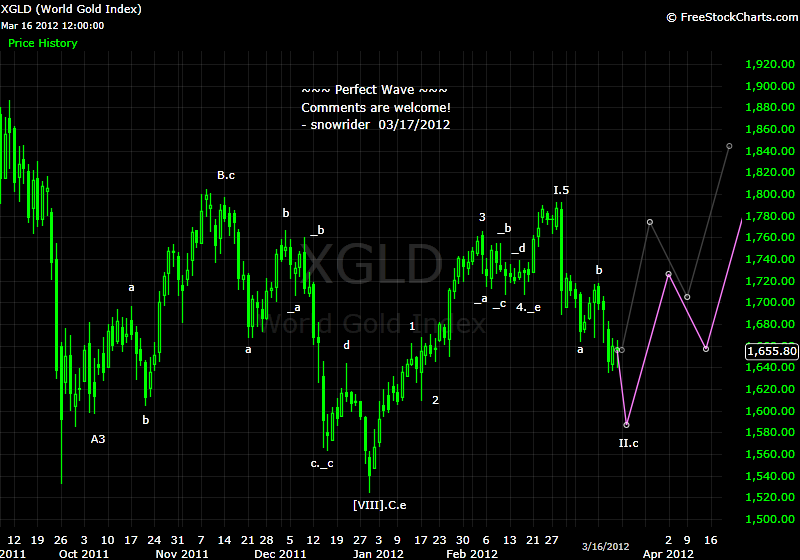
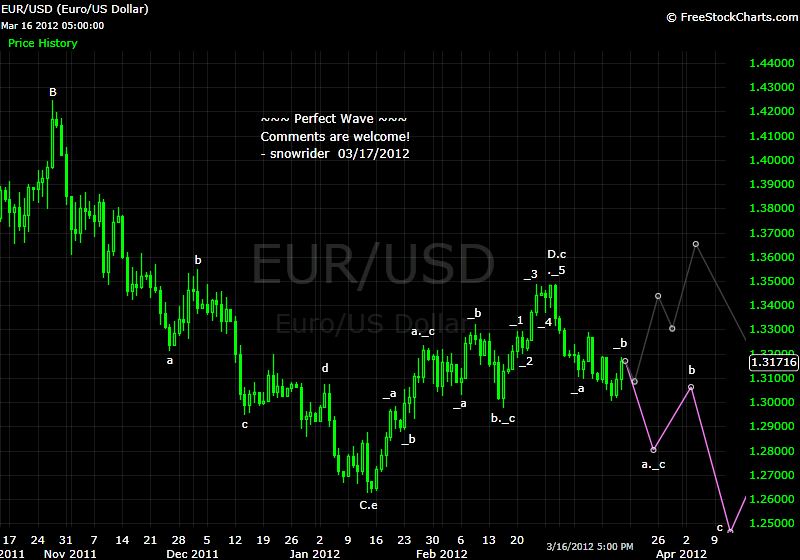

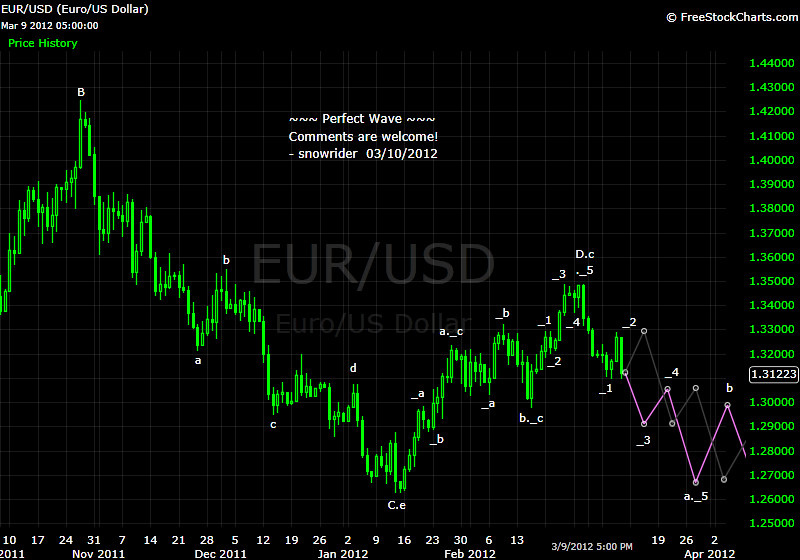
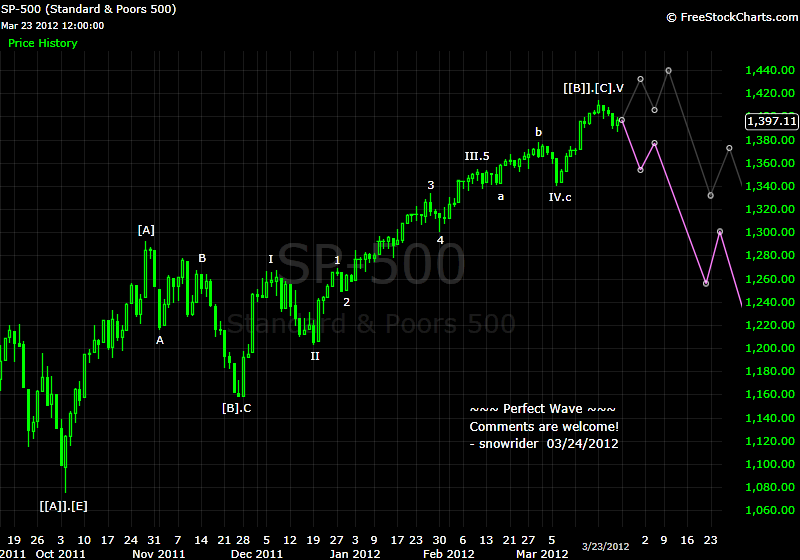
Opinion is that we are due somewhat of a correction in the SP500.
Nice work Snowrider! SP500 will close the week under the 1400 mark and reinforces the downwards trend.
Quote from MADASINHATTER:
Yeah i got one.Why do you call it perfect? Do you mean in hindsight? Or is it part of the new world order where you take a word or phrase and use it to describe the complete opposite? Like saying " bringing peace and stability" while dropping bombs on people.Is it perfect in that sense? Where you show that it could go either up or down,on a scale of 1-10 how useful and perfect is that,say compared to just guessing?
Quote from bwolinsky:
What has your backtest showed and what have your results been?
It's apparent some logic's went into the chart drawings, but none placed on any performance summaries or analysis of the data.
Reminds me of Hershyites, must draw straight lines, without questioning whether they actually did go to where they ended when they were drawn or any regard to what actually happened later.
This thread is missing that analysis, and it's required if you expect anyone to really analyze the charts that have been posted.
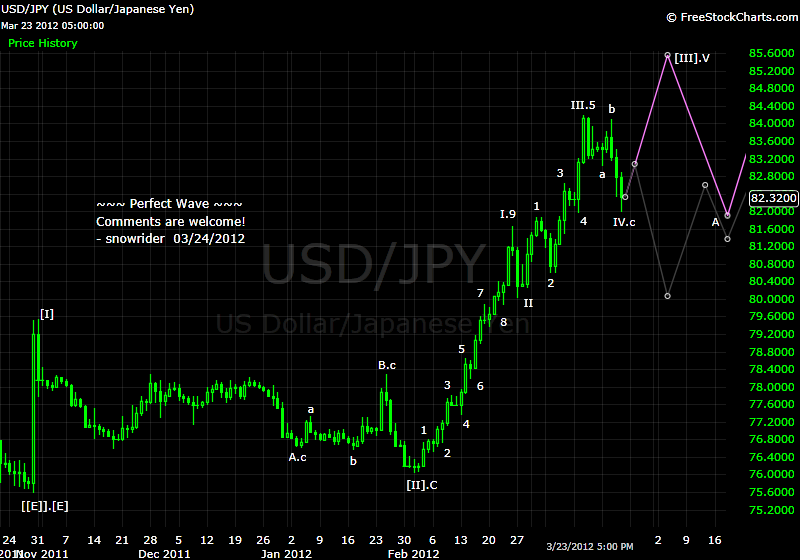
有种!
我转了一圈,就没有看到别的论坛有熊帖子。 熊军很孤独!
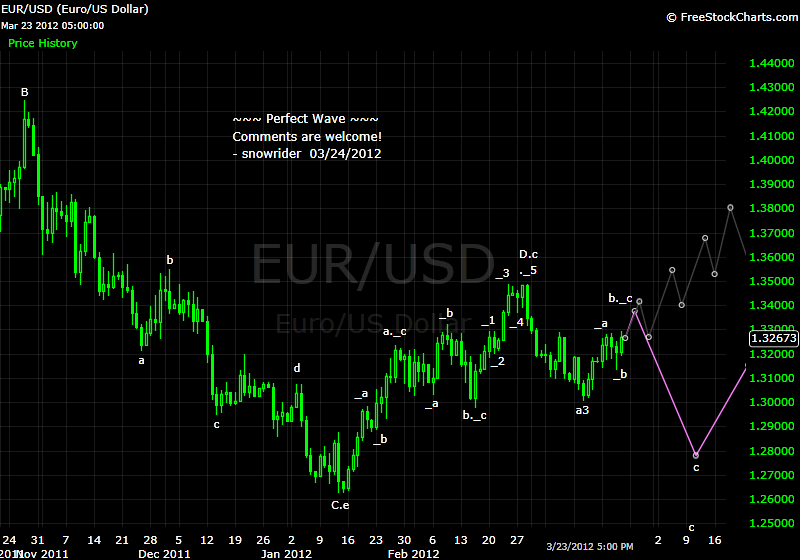
Hi snowrider some great posts on EW well done, some interesting points mapped out in the S&P.... I just have a question... is there any distinction on grey/purple trend lines? i.e one more probable than the other
Quote from Wide Tailz:
For similar reasons, I have a lot against fundamental analysis.
EW fits into my trend following system by filtering the buy signals by wave type. My be$t trades, by far, have been during a third wave (either the general market or the stock itself).
Wave 3 is the first higher low and breaks the previous trend line, and typically follows noticeable divergence in MACD, RSI, money flow, Stochastics, ROC, and any other momentum indicator. A huge candle as the dam breaks is the final confirmation.
OP: my comment for your analysis is that I'm amazed how far you take the corrective wave counts. I've never had much success trying to analyze them. I see the SP500 currently in a B wave completing the C wave of next lower degree, itself seeing wave 5 of next lower degree completing as I type.....

Snowride: Seems the correction beteween the two peaks may not bad, formally start tomorrow?
Cha ...
NYQ 发表于 2012-3-27 16:06
今日低點剛好打到上升軌 (03/06, 03/23 的低點) 看似這個牛市還沒結束 以波來看
如果 V.1 (03/19), V.2 (0 ...
snowrider 发表于 2012-3-28 15:59
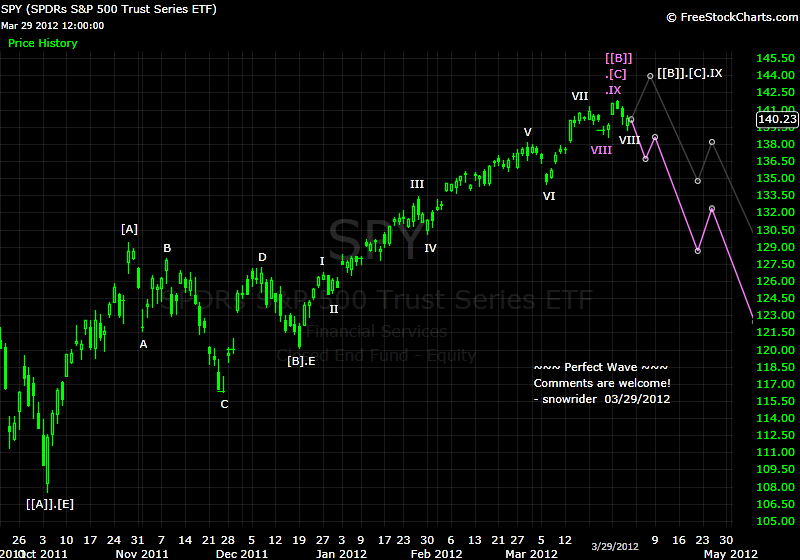
So purple is your preference? I will bet the gray line with around previous peak as the t ...
NYQ 发表于 2012-3-29 21:39

OK, I see. So you just used your traditional way of drawing, purple is not always your pre ...
NYQ 发表于 2012-3-29 21:46

雪骑的灰线似乎比红线要准。以后可以换换颜色了。
...那你又不用任何线线或指标, 就看裸图, 怎么判断是不是向某个方向突破了呢?
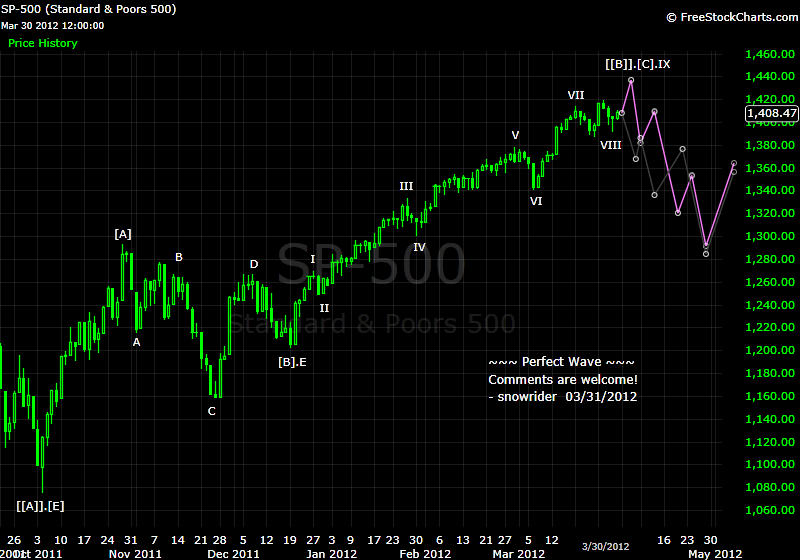
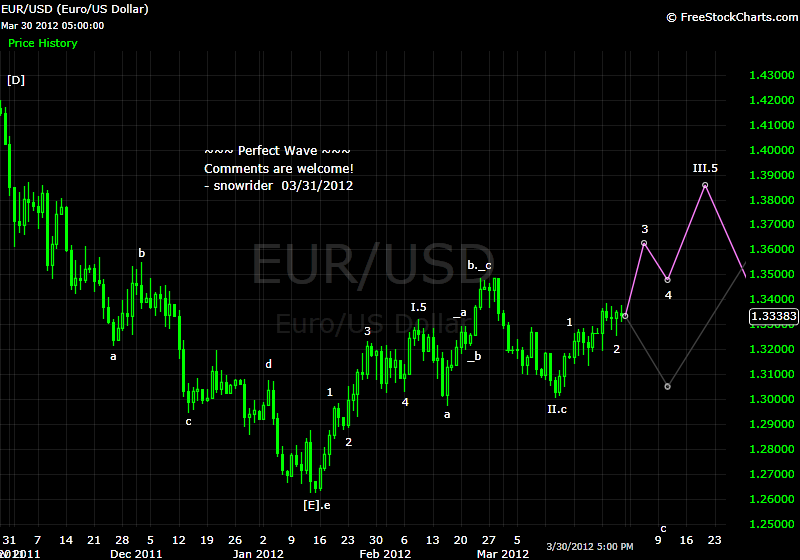
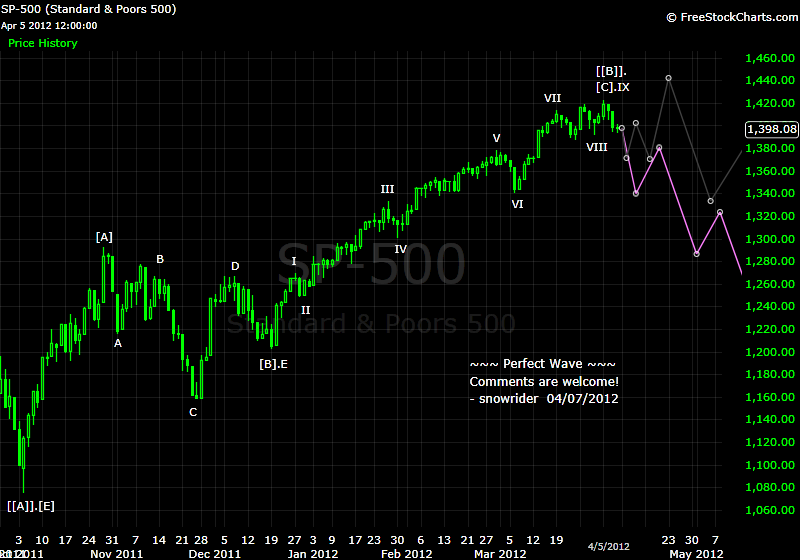
为啥有个1440大顶...牛市不轻易猜顶是大原则啊@_@
老兄我今天赚了钱多废话两句,你的操作怎么总和你画的线相反呢?
他总是赚钱的, 你不知道? ...
没觉得你是吹牛,也相信你操作赚钱。只是说数波到底能不能指导操作,不是我看表面不看内容,你图上说到1440,如果信的话1394的时候我是不敢加仓short。
anyway,我数波从来数不对,天资太笨。
今天废话太多,就此打住,大家发财。 ...
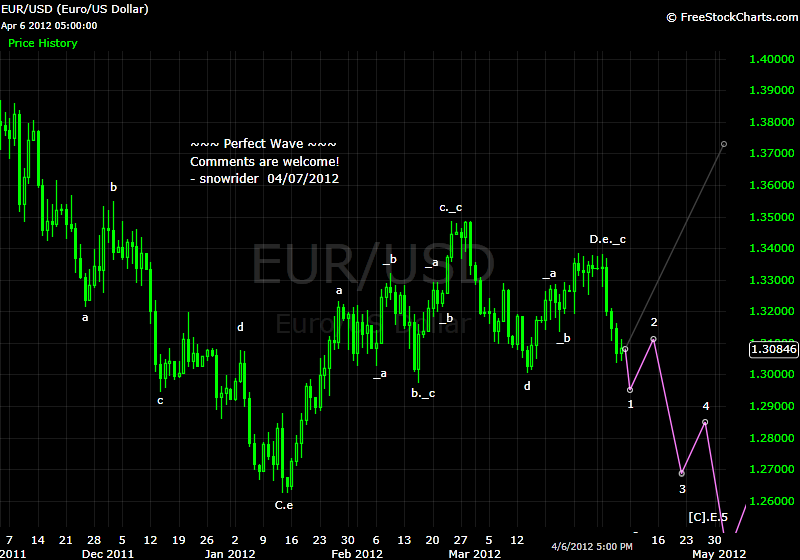
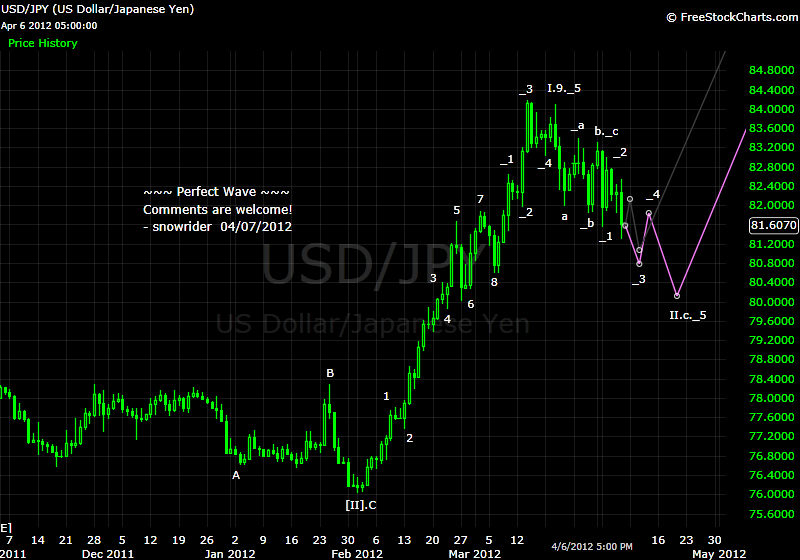
Quote from ScalperJoe:
snowrider,
I am discussing the current waves with trader collegue regarding the S&P, and we have come to the following conclusion that Wave 5 of Wave 3 has completed, and the S&P is currently in Wave 4. I've also read and heard that Wave 4 of the larger pattern already occurred, however our analysis is there has not been any significant pullback to justify a completed Wave 4.
Our wave counts of the larger pattern (weekly chart):
Wave 1 from 1,075 to 1,293
Wave 2 from 1,293 to 1,159
Wave 3 from 1,159 to 1,422
Wave 4 will result in a choppy "A-B-C" pattern, perhaps stalling around 1,320 (38.2% fib of Wave 3), although holding well above the top of Wave 1 at 1,293.
Then a rebound Wave 5 pattern which will break the top of Wave 3 of 1,422, hence completing the 5 wave pattern that began on October.
A larger correction (perhaps 50%) of the completed 5 wave pattern will create the next big buying oppourtunity.
Please provide feedback/comments to this analysis, thanks.
...
One question for you is that you think we are still in the wave 4 from peak of 2000? What formation will this wave 4 take?
...
现在从大浪上看:普遍认为是ABC调整浪,还是I,II,III,。。 上升浪? 我想说的是2009 三月以来浪的普遍说法。
| 欢迎光临 华人论坛 (http://list.yayabay.com/forum/) | Powered by Discuz! 7.2 |